Saturday, August 9, 2014

Intro Stats Unit Idea

I have lots of projects in Stats, but the start of the course is always a bit flat without an engaging, overarching project that connects surveying, sampling methods, summary statistics, graphs, and confidence intervals.  All of these topics use one quantitative or one categorical variable and encompass the full process of collecting, analyzing, and presenting data (exactly what I look for in a good project).  It is a set of topics that shows up in the high school required standards (Minnesota and CCSS) and is foundational in AP Stats.

Last year, I carved a lot of time out of the class for students to define their own projects (around 40% of the course).  For a variety of reasons, I plan to cut back on that open time, but I will build in some of the better ideas into the core curriculum.  One idea that students had a lot of fun with was a "would you rather" survey of seniors at school that they turned into a visually appealing infographic (click to enlarge):


As a kick-off activity on the first days of class, I like to do some kind of simple survey using Google Forms to get students used to the idea that questions are variables (the response set), these variables come in different forms (most notably quantitative and categorical, but also ordinal and qualitative), and people are individuals (which are the rows in a spreadsheet).  I think this would still make a good opening activity, but now we would start a questioning each part of the rushed process after we finish:

  • Who did our data actually represent?  If we did a convenience sample of most of our class, it hardly even represents the class well, let alone the school or all US high school students.  What if you wanted to talk to the same number of people and yet say that your data represents student opinions from across the state?  This would require a better understanding of population and samples, instruction on sampling methods, and a better foundation in randomness (all of which are where I would insert my videos, a lecture, or a mini activity to instruct on these needed stills).
  • How effective was the presentation of the data?  Did you share everything or select only the most interesting graphs?  Did you break any graphs down based on conditions or only look at overall answers?  Did the audience find it visually appealing and interesting to look at?  Does the presentation of the data deceive or dance around any issues?  What other ways could your data be presented visually?
  • How well did you communicate the uncertainty in your results?  Does 75% mean exactly 3 of 4 or is there a margin of error?  Where does that margin of error come from?  Does it account for bias in question wording, questioning technique, or sampling method?  Could you find a confidence interval on your first survey data, and why / why not?  Can you explain in only a few characters on an infographic what your confidence interval tells you?
This would lead to a new (or simply refined) survey project where students generate a set of 5-8 questions that they find interesting, limiting themselves primarily to 2-option multiple choice questions (would-you-rather questions work great for this) and quantitative response questions.  Scale questions (rate from 1-5...) are technically not quantitative because the difference between 1 and 2 may not mean the same as the gap from 2 to 3, plus the numbers are usually more subjective, but they work well (somebody please convince me they are okay or not okay).  Otherwise counting how many days/week or times/day a person does something works too.

To collect the data, we would probably use a school-wide random sample stratified by grade (gender would be nice too, but it is harder based on the lists I get access to).  Instead of having many groups annoy every classroom, we would try to consolidate all of our questions into one or two surveys and split up the randomly selected students.  We would only decide this after class discussion and consensus, so they might choose a different method if it works well (like regular SRS).

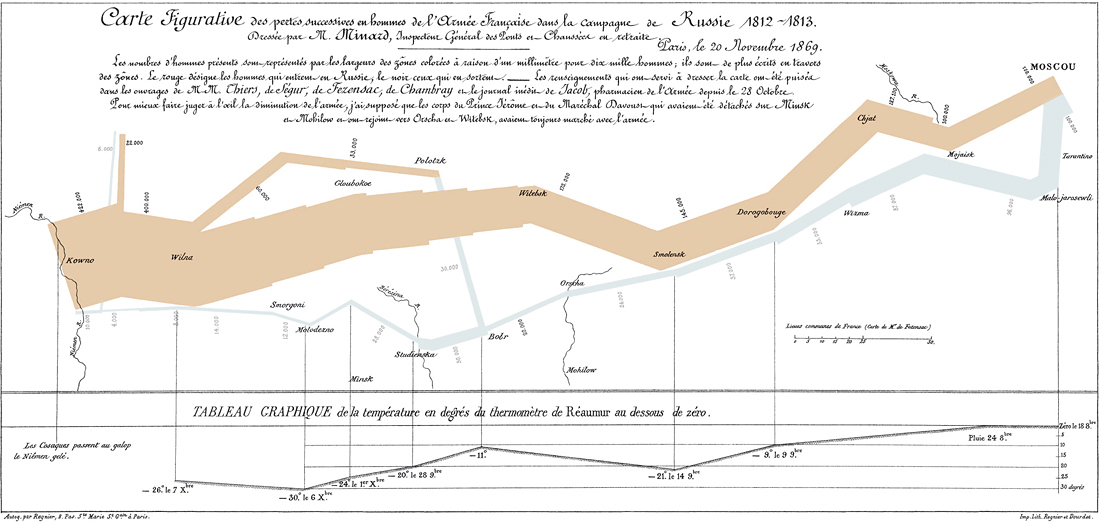
With data in hand, I plan to teach mini-lessons on data presentation, learning primarily by example and discussion.  We would start with traditional graphs like stem plots, box plots, histograms, dot plots, bar graphs, and pie graphs, making sure we use the right ones for the type of data / size of data set, and discussing how they could be extended or improved to be more visually appealing (such as making the bars some kind of image or filling in a proportion of an image instead of a pie graph).  To push students beyond the basics and force them to think more creatively, this would definitely include my favorite graphics of all time: Death and Taxes and Napolean's March (both below, click to enlarge if you have a ton of time to kill, because if you read my blog, you're nerdy enough to stare at them for hours).  


In addition to visual summaries, we like to summarize data in numbers.  Categorical data gets boiled down to a proportion while quantitative data gets a lot more complex as you describe multiple measures of center and spread and consider both in the context of its shape.  Discussing the tradeoffs between mean and median and using case studies where students defend which statistic is the better summary could set up a nice baseline before they start throwing numbers all over their infographics.

Before students get too carried away with how they will present their graphs and summary stats, we need to spend time learning about the limits of our precision.  Connecting back to sampling, we can simulate in class the idea of taking an SRS of the same population multiple times with varying results, eventually getting to the big question -- is the average and variation predictable?  After a few time-consuming in-class simulations, we can take a trust leap into a computer simulation (I like StatKey).  Thousands of iterations reveal that there is in fact pattern and order to the means of the simple random samples, allowing us to say how confident we are that any one sample fell within a certain range of the true population mean.  I plan to get deeper into inference in the next unit, so just introducing the idea that uncertainty is predictable should be mind-blowing enough for now.

As we work through all of these components in class, there will be a few individual assignments and checkpoint quizzes (probably multiple choice for instant grading and feedback) to make sure all students are learning the core material.  If a student does not score 80% or better on the quiz, they will need to meet with me individually or in a small group before their group can turn in any shared assignments (thanks to Kris @KHaeussinger for that idea).  This adds individual accountability and a check that the supporting content is being taken seriously and making sense.  Beyond that, students will spend most of their time working on their infographic project in teams of 3 that I create at the start of the unit (based on experience as a student and as a teacher, 3 just seems like a magic size for most things).  As we get about halfway through the unit, I want teams to start to give each other feedback.  There are structured formats for this such as a gallery walk or critical friends that should be used to quickly generate constructive ideas instead of "oh yeah that looks great".

The final product is a large color poster for display in the halls of the school.  To share them with the class, we would hold a poster session where one teammate stays back and two float to see other posters and listen to mini-presentations.  Rotate 3 times and everyone would both present and watch.  I would float and ask questions / assess the final product (pulling in the floating team members when I'm present at their poster).

WHEW.  That was a lot longer than I expected...I guess I had been giving it some subconscious thought for a while.  That said, none of this is set in stone and I want it to be awesome, so please point out the areas that could be stronger or got overlooked and I look forward to incorporating your feedback.  Shoutouts to Megan @veganmathbeagle and Dianna @d_hazelton for helping me think through some of this and pushing me to write it down.  Besides ideas for seniors, it will be awesome to hear what this might look like for 9th graders / non-seniors as well.

Friday, August 1, 2014

A half-baked unit idea for hypothesis testing

The first topic that broke me as a teacher was teaching hypothesis testing as a student teacher.  It broke me so bad that I totally changed my stats course to better engage students in the statistical process.  It was the catalyst that fixed so many other things in my class, and did improve how I teach hypothesis testing, but kids still struggle with it more than anything else.

At TMC14 last week, one huge theme in many of the sessions and "My Favorites" was getting students to talk about math.  The example that stood out to me was Chris Luzniak (@PIspeak)'s first session on debating in math class.  He focused on structured arguments.  When students raised their hand to share, he asked them to make a claim (statement) and then give a warrant (reason).  He builds a culture of listening, clearly stating a view, and backing up that view with sound logic.  Chris uses mostly informal debate (more like a classroom discussion), but for the purposes of this new unit I think I want it to be more of a prepared debate.

I am trying to envision a unit where hypothesis testing is taught in multiple ways and students, as their unit project, are left in teams to defend their preferred method for making decisions with data.  I see two big questions that should be very approachable by my students:.  The first is whether to use simulation or a probability model to obtain a p-value:

  1. The AP Statistics curriculum, along with nearly every other stats course, uses a probability model (the normal curve) as the basis for inference.  Because of the Central Limit Theorem, even the craziest of distributions have a very normal looking sampling distribution if the sample size is large enough (often >30).  This method for doing inference is clean and analytical (could be worked out by hand).  The downside is that, like all models, there are some assumptions that must be made that are not always valid, especially with smaller samples.
  2. The preferred method of many programmers (including me) is to create a very simplistic model in software and repeat it thousands of times to create a sampling distribution.  This method is called bootstrapping.  Even though programming may not be accessible to most students, tools with clean interfaces such as StatKey make it easy to perform the calculations.  This method for inference is very easy to understand and explain (drawing values from a hat), and since computers are fast, it is just repeated many thousands of times.  It also does not require any assumptions about the size or shape of the sample's distribution.
  3. If you understand Bayesian hypothesis testing, you could have kids argue for the need to use likelihood ratios based on meaningful prior probabilities.  Despite spending half of the day researching it, I really don't understand it well enough to explain it to anyone else, so this option is out for me.  If you want to learn, one awesome option is a free book one of my college computing professors wrote called "Think Bayes".
The second question is why we need p-values at all:
  1. The traditional hypothesis test starts with a default claim and seeks evidence that suggests it to be unlikely.  The statistician starts with a threshold level, such as 5%, and tries to show that there is less than that probability of finding the data they found when he assumes the null hypothesis to be true.  The actual probability, the p-value, is often reported along with the decision to reject or fail to reject the null.  This is seen in nearly all science publications.
  2. Another viewpoint held by a minority group of stats folks (including me) is to not use p-values at all.  Instead, a correctly computed confidence interval could be compared to a null hypothesis to see if the null mean is captured by the interval or not.  For example, a soda pop can of Coke (covered all my regions there...) claims to have 12oz of liquid inside.  I am trying to prove that it is less than 12oz in a one-sided test at the threshold of 5%.  Instead of finding a p-value, I could create a confidence interval around my data.  Since I want each tail of the interval to have 5%, the interval would be the middle 90%.  If my 90% confidence interval was 11.5oz to 11.9oz, then I could conclude that I was being ripped off.  The reason I like this approach, despite its apparent complexity, is that it doesn't just tell you that you are getting ripped off -- it tells you how much pop you can expect to get in the can.
The point is not for the teacher to ride their high horse about their answers to each question.  The fact is that there is a group of intelligent people who support all of these answers, so they could all be defended in front of the class.  In order to make a good defense, each group needs to understand their opponent's responses well enough to counter their argument.  The normal-curve based model will be fairly non-intuitive to my students since I plan to introduce them to inference using bootstrapped confidence intervals in a unit on infographics.  They will need to understand enough about the Central Limit Theorem to argue why the normal curve is a good model and know the assumptions that are made to use it.  They will want to demonstrate how easy calculation can be with a TI-83 and how easy it is to explain with a sketch of the normal curve.  The simulator groups will need to understand when every simulation yields a different answer and why increasing the number of bootstrapped samples converges the answer to a more precise value.  They need to understand why they don't need to check any assumptions (other than having a SRS) like the other groups need to do.  There are a similarly large number of key ideas that need to be well understood about the second question to properly debate it as well.

The big graded tasks in the unit would probably be giving and receiving feedback in mini-debates between paired teams, a final debate between groups in front of the entire class, and a write-up after the debates picking a personal stance and communicating all that they learned in the process.

The unit would be kicked off with the big question of "how can you use data to make decisions"?  From there, we would generate a list of topics we needed to know more about in order to get ready for the debate.  Some of these big ideas I would lecture on for the class, while less conceptual ideas would be left for students to watch in my videos.  I would also give short quizzes to make sure students were grasping the basics of hypothesis testing and the different approaches so I could target struggling students and their groups for quicker intervention.


So...I need help.  I'm sure there are a ton of holes in this concept or things I did not clarify that really matter.  I would love to not only turn this into an awesome unit for my classes, but for everyone who would want to use it, so please poke holes as ruthlessly as if it were your own curriculum.  Thanks!

Thursday, July 31, 2014

Seeking in the MTBoS

A recent post by Greg Taylor got me thinking about what I'm actually looking for when I started to engage in the MTBoS (Math Twitter BlogoSphere).  Initially, I was just exploring the space to see who and what was even out there, hoping there would be somebody who would want to help me develop my new Statistics class (about 2 years ago).  Since then, I have just been content with finding stats teachers on Twitter and following their blogs.  My best discovery, Glenn Waddell's blog, has supplied me with all kinds of good ideas that I've put into practice.

TMC14 (Twitter Math Camp) was awesome last week.  For the first time, I feel like I was finally able to meet all of these people I saw online, along with a ton of other stats teachers who I had no idea existed (I have a feeling they didn't know I existed either).  More importantly, I started to get to know this group of awesome people and see the huge variety of personalities, types of schools, personal interests, etc that is just hard to see through a Twitter feed.  At the same time I met people in real life, I finally got some traction on understanding how to communicate with this group via Twitter, a skill that will serve me year-round.

Getting back to Greg's post, I had my first negative reaction to my awesome week after reading.  It triggered the realization that I didn't find what I was looking for deep down -- somebody who wanted to completely take apart and redesign high school stats.  Everyone seemed to have a basic mental framework for how stats worked and wanted to incorporate new activities, ways of explaining, and tech tools into that framework to improve their course.  I wanted to completely dismantle the course and build it back up with the core elements I value -- real-world application, fun and engagement, minimal homework, and lots of student autonomy.  Over the past couple of years, I've been doing this on my own since I've been fairly unplugged with the community (my class site, my rationale for my outline), but I want that to stop.

So my plea: is there anyone out there who just feels like stats class is fundamentally flawed, who is willing to break completely from a textbook, who wants to try full-on project based learning in stats?  More than sharing lesson concepts or activities, but a full-on commitment to design a new course that we co-teach during the year?  I hope the design process we engage in leads to the ability to reuse many of the videos, homework problems, projects, and assessments that we've used before, but if it doesn't and that reason matters, I want to build out whatever resources we need.

I'm so thankful one of my co-workers was open enough to teach my current version of stats with me this upcoming year so he can question and help me refine the course.  Maybe, once we get into the thick of the school year, I won't feel this isolation with stats anymore.  However, I still want a teammate in the thick of the design process (now) who is as bothered as I am by typical stats classes and thinks there is something to be found by creating an effective project-based curriculum.  I don't care how much or little you know about stats -- I was clueless two short years ago.  I just want somebody with the same mindset and goals.  Thank you.

Wednesday, July 30, 2014

TMC folks like to play

I'm was a first-timer at TMC (Twitter Math Camp, which is a real thing) this past week down in Jenks, OK.  If I had to describe it in a sentence, it is a gathering of passionate math teachers who actively blog, comment on each other's blogs, and tweet at each other year-round to improve their practice and be a community.  The TMC crew is incredibly open and responsive to newcomers.  As a group, I also noticed a surprisingly high level of emotional intelligence when interacting in person.  It was easy to listen in and be listened to.

Only after a couple days did I pick up on my biggest insight: TMC teachers love to tinker and play.  Justin L was sitting one night playing with ways to generalize a parabola without completing the square.  Edmond spent a few days playing with paper cutouts so he could let others build an awesome 3D soccer-ball-like shape.  I've been enjoying recent posts from Jonathan and Glenn as they talk about playing with different structures of the curriculum in Algebra 2.  Malke was busy every night in the lounge inventing new math dances.  Even when I look at the thing people found most interesting that I worked on - a simulation of Ultimate Frisbee that is used to replicate the Moneyball process - it was not the most time consuming thing I worked on to make my stats curriculum.  It was the most playful thing - something I made on a whim the weekend after I saw the movie Moneyball for the first time - because I thought it would be awesome to do.  Once I started to notice the playful attitudes most of the other TMC campers took, I noticed it everywhere in the group.  And I couldn't help but notice that teaching kids to play with math is something we, or at least I, almost never teach or even encourage in class.

How I organize statistics

A few discussions at #TMC14 and a recent Twitter conversation with @pamjwilson reminded me how differently I organize the topics in my statistics class.  Instead of trying to explain the what and why of this in 140 characters or less, I made this.

The AP Stats standard syllabus, the golden standard for even non-AP high school statistics classes, organizes the course into four major themes: exploring data (summary stats and graphs), collecting data (sampling and experimental design), anticipating patterns (probability), and inference (confidence intervals and tests).  The groupings make a lot of sense once you have a good idea of how stats works.  They also make a lot of sense if you are efficiently covering procedures through the textbook.  However, I don't think to do a good job introducing the new student into how this collection of procedures can be put to use.

When I completely pulled apart my class and abandoned textbooks, I started with a set of interesting projects first, and then worked backwards to attach relevant topics from the syllabus to the projects.  This took a couple of semesters to iterate, but eventually I noticed a beautiful thing - you could go through a complete flow of collecting, describing, and performing inference on data with every project.  In addition, a natural break between one-variable techniques and two-variable techniques emerged.

Starting with one-variable stats, for the purposes of AP Stats, you can have either quantitative data (numbers) or categorical data (multiple choice options):

  • One-variable data describes a population, so you can either perform a census or take a representative sample (SRS or equivalent).
  • Once data is collected, it can be summarized (quantitative with center, shape, and spread, and categorical with proportion).
  • It can also be graphed (quantitative with histograms, dot plots, and box plots, and categorical with pie graphs and bar graphs).
  • If you collected a representative sample and want to know how precisely your data predicts the actual population, you can simulate a sampling distribution and create a confidence interval.
  • You can also check that your data provides sufficient evidence to prove a prior hypothesis incorrect by calculating a p-value.
  • Finally, I end the cycle by asking students to communicate what they did and what they now know by writing or presenting their process and conclusions.

Now that students have a conceptual overview of collecting, describing, analyzing, and presenting data, we repeat the full cycle with two-variable data.  The first cycle I do is analyzing two quantitative variables:

  • Difference in purpose of two-variable analysis (not to describe a population, but to identify relationships between two characteristics/variables within a single population).
  • Introduce observational studies.
  • Create scatter plots, discuss correlation vs. causation.
  • Perform regression and create a model to predict one variable given the other.
  • Use a confidence interval or test of the slope to better understand the variability in the model.
I repeat the full cycle one final time with a categorical explanatory variable (group A vs. group B) and either quantitative or categorical response variables.
  • Teach experimental design as a way to create two groups that are identical in every way except one key characteristic.
  • Compare two sample data graphically (quantitative response with stacked box plots, categorical response with adjacent bar graphs).
  • Compare two sample data with confidence intervals and tests to establish that the groups are statistically different (or not).
  • End the cycle again with students presenting their conclusions in context.  A statistically significant difference between groups means that the explanatory variable affected the outcome.
If you think that looping this process so many times would require far too much content in the first cycle to effectively teach inference, you are right, unless you teach only the concept and skip the calculation.  I use StatKey, a free, iPad-compatible online simulation calculator, to perform all initial inference calculations with students.  This prevents me from formally having to introduce the normal curve and its probability calculations, lets me skip most of the Central Limit Theorem, and lets me completely ignore the nit-picky assumptions of most intervals and tests.  By the time students get through all of these cycles, they have such a better conceptual foundation for everything we're doing that it is far easier to go back at the end and properly teach probability.  It is simply giving a new technique to calculating numbers they already understand via simulation, but now can understand via the magic of the normal curve and Central Limit Theorem / Binomial Theorem.

If you want a living example of how this organization works, check out my class website.  This fall, I am further modifying it to better use projects to motivate each cycle without having to frontload the content first.  Please comment if you have questions or can push me to think differently about how this is setup.

Wednesday, May 14, 2014

Cutting down feedback cycles

I want to build independence in my students.  I want students to be self-directed, self-motivated learners.  I want to give students freedom.  I took most of this away from my Geometry students in the past two units to see what would happen if I micromanaged their progress and refused to let them move on until I personally verified their homework as completed correctly.  The idea was to shorten the feedback cycle for students doing practice problems as much as possible.

Background: as a department, we historically gave our students a complete solution key to the homework problems so they could check their work as they went.  We took time to talk through strategies on how to effectively use the keys as checks, not crutches, and why copying the key was a waste of time for their final grades.  In the past year, we all started cutting back to only the odd solutions because students were becoming too dependent on the keys.  This quarter, I went even further and pulled the solutions, leaving only the odd answers (not full solutions) so students could simply check themselves as right or wrong and seek help for wrong answers in class.  The problem was that many never bothered to check answers -- who could blame them when we grade on completion?  So my next step was to start checking random problems from each assignment for accuracy.  My student assistant took on the brunt of the work and skimmed through PDFs for a couple of answers per assignment.  The results were pretty sad -- many students got odd answers wrong along with evens.  In fact, the homework scores were pretty good predictors of quiz and test results, so we were finding the kids who would struggle based on their homework quality.  The problem was that by the time we knew this, it was too late to do much for that student.  On the test we took before I moved to the new system, 48% of my 1st block students were proficient (above 80% on the test) and only 18% of my 4th block students were proficient.  This is not far from some historical proficiencies, but my one class is still the worst ever recorded in the department.  Extra conveniently we took this test just in time for me to get it in the gradebook for parent conferences.  The point is that I desperately had to do something different because the wheels were falling off.

2013-14 Proficiencies on Algebra Expressions test (traditional flipped)
(first 3 are each different teachers, and my classes are in red):
46%  22% 22% 48% 18%

To change things up, I created worksheets with 6-8 problems each.  A page was a single type of problem.  I made videos that explained how to do 2 of the problems per page, but the videos were optional -- if students knew how to solve it on their own, they didn't have to watch it.  After completing a page of problems, I came over to their desks and checked them off in my gradebook.  You didn't get to move more than a page ahead without getting checked off, and if you did it wrong, you had to redo the work (if a student was repeatedly failing, I would take extra time to walk them through).  Before each quiz, students took a practice quiz of similar style and length to the actual quiz.  This allowed students to do a final check and still get group and teacher help (the primary benefit of a group quiz) before jumping into the first graded assessment on the material (an individual quiz).  After the quiz, they repeated this cycle through four major sections of four worksheets each before the unit test.  All students tested on the same day.

The logistics were chaos, I was running around class with my head cut off to get to everyone, and I don't think I would have survived one of my two classes if I didn't reassign the student assist who used to grade homework to be an in-class checker and tutor.  But all I cared about were results -- if the craziness made kids learn, I didn't really care about much else.  The good news: I hit 78% with my stronger class, and more surprisingly, I made it to 69% with my struggling class.

2013-14 Proficiencies on Algebra Equations test (checked problems, quiz when ready)
(first 3 are each different teachers, and my classes are in red):
83% 44% 28% 78% 76%

Before seeing the test data, I knew some things were going right based on the change in the conversations I overheard from students.  Students would ask very specific questions about how to do parts of the problem instead of the time-tested "I don't get it".  They would yell at each other for doing problems wrong and actively point out errors in each other's logic.  They would get mad at me for trying to run away from them and not stay long enough to help (and still do).  The class was still crazy and energetic, but there was a sense of purpose in the air.

Going forward, I knew I had to adjust the logistics to keep things a little bit more sane.  Initially, there were papers everywhere.  Halfway through the first new unit, I started making stapled packets for each of the parts that kids could write on and keep.  Now, I adjusted the system to use a stamp.  Every correctly completed page of student work gets a "Mr. Pethan approved" stamp which I find incredibly efficient and students find amusing (I just have to make sure I don't leave it around or I find people stamped with "my" approval).  Students also find the "click" sound of the stamp to be a good feeling after solving a triangle the wrong way for 20 minutes and finally getting it right.  When students are ready to quiz, I take their stamped packet and give them a quiz to take on the side of the room.  I can record and grade everything pretty quickly.

A few additional things to note: I would not completely call this approach flipped mastery, since I do not allow retakes on any assessments.  I just don't let students take assessments until they demonstrate understanding on their practice problems, so I no longer see many failures.  In fact, only one student in either class failed this test, mainly because he didn't finish some of the final sections before the test and I didn't realize how far off he was before throwing him into it.  To help students stay on track, I allow them to come in at lunch or before / after school.  Lunch is by far the most popular option.  When students get more than a day behind, they get to send an email to me and their parents to let everyone know where they are at and their plan to get caught up.  This helps as a prevention from falling behind and accountability if the student is behind.  When needed, I can also require that students come to my room at lunch for longer-term catch-up and help.

With only one unit done and tested, a lot of this is still up in the air.  That said, I have some early quantitative and qualitative validation that things are working and I've smoothed out some of the kinks in the logistics.  I will keep posting on how things progress through the rest of May and what I plan to do with this heading into next year.


The Lean Startup

I'm obsessed with audiobooks.  Before them, I probably read 20 books in my life outside of school.  With them, I crank through two pretty decent sized books each month, around a variety of topics, but mostly psychology, entrepreneurship, faith, and education.  Thanks to Audible, I even read the entire Bible in a few months last year.  Most of my reading occurs on my drive to and from work (20 minutes each way at 1.5x speed is an hour of reading per day!).  Part of each summary is my key themes from the book.  The rest is how the book has reshaped or reinforced my thinking.

The Lean Startup (by Eric Ries) redefines the metric of success for startup businesses.  Traditionally, we might look at revenue or users to judge early success, but Ries calls these "vanity metrics", as they are more useful as bragging tools than as proof that you understand your customer and their wants and needs.  Instead, he recommends using "validated learning" as the key metric.  Validated learning comes from taking an assumption that is key to the success of the business, running an experiment with minimum cost and time, and demonstrating whether or not the assumption is actually true.  One concrete example comes from the founder of the online shoe store Zappos.com: the key assumption is that people would be willing to buy shoes online.  To validate this assumption, the founder created a small website that looked like a legitimate retailer of shoes and promoted it online.  When people actually ordered from the site, he drove down to a nearby department store, bought the shoes at retail price, and shipped them to his customer.  Every transaction lost money and was time consuming, but through this process he was able to figure out exactly what people wanted from an online shoe retailer without the financial risk of investing in a warehouse of shoes.  If the website completely failed, he would have moved on to other ideas with no major loss other than a few weeks of time and a few bucks.  Instead, he bought himself lots of time to tweak the website and run additional mini experiments that tested different designs and policies to see how they affected sales and customer satisfaction.  When he finally did commit to having a warehouse, suppliers, and employees, he already had a lot of the validated learning done and put his investment money into the right areas to quickly grow the business.

Taking a step back, I want to clarify that a startup is not a new business using a proven model, such as a pizza restaurant in a new town.  It is an organization creating new products or services for a new customer.  Many startups begin with hunches around a pain point or problem, but they don't know exactly what they are going to make or who is going to buy it.  This is why advanced planning and business plan development are a massive waste of time for an early startup -- they have no idea what they need to do yet.  Until they have validated that they have a product that a certain customer segment wants to buy, and they have even taken pre-orders for these half-fake products, they should not be wasting any time executing on the details that do not validate core assumptions of the business.  This is hard for designers and developers with a product vision, which is why one of the huge themes of the book is discipline in business practices.

As an educator, I want to spend more time challenging the core assumptions that our school and curriculum are based on using experiments across different classrooms and with different teachers.  True split testing experiments are difficult in a single classroom with one teacher, but there might be creative ways to move kids between teachers in the same block or give different tasks to half of a class in a more flexible environment.  Below are a few assumptions that I and/or our team is already starting to question, but need better testing methodologies to fully understand:

  • We should give students the solution key to self-monitor their progress: my experience tells me that most students are poor self-monitors due to a mix of not understanding the difference between solution key answers and their answers, not knowing why they made a small mistake that actually occurred from a major misconception, and not caring if they are doing the problem right.
  • The most efficient way to group material is by similar topic: After years of math was developed, we found efficient ways to compact the material.  We put all of the factoring into a factoring unit and teach 4 methods for factoring different types of problems.  When I rebuilt my Stats class, I placed content around the types of problems they could help you solve instead of in the traditional syllabus order so real-world projects could motivate and reinforce content work.
  • Students need two quarters to complete a math course: This seems like an obviously flawed assumption.  Despite this, I know of almost no schools that offer a continuous course called "math" that lets kids move at whatever pace they need to.  Everyone has courses that advance at a single pace dictated by the content that needs to be covered and the time allotted to cover it.
  •  The current sequence of courses and topics is the ideal way to teach them: Teach number operations, then algebra, then geometry, then more algebra, and then calculus.  Teach polynomials and all of their operations, then teach factoring in its many forms, and then jump into rational expressions and equations.  Why couldn't you teach calculus concepts (it's just area and slope) to 3rd graders and give them tools to handle the nasty algebra?
  • Following the standards as prescribed is necessary: I don't know anyone crazy enough to ignore the state's written standards, as a whole district, and teach what they think is best.  If I were in charge, any factoring without a computer might get kicked out to free up time to build mathematical models of real-world systems.  Just ignoring the standards related to factoring would eliminate an entire two week (block schedule) unit in Algebra 1 and Geometry and would save another week or more in the rational expressions and quadratics units.  Kids would (probably) get more MCA problems wrong as a result and we would be intentionally ignoring a state mandate.  I think this extra time could strengthen everything else we do and leave more time for meaningful application.
  • 1:1 iPads are a tool for learning: I think this depends on the task.  In the "solve these same problems" environment that we created for our kids, the iPad doesn't have nearly as much to offer.  It does allow for videos to quickly viewed on demand and saves paper, but a multi-purpose device that has so many built-in distraction tools makes it hard for kids to stay on task during long problems.  Jury is still out here and we have little data to beyond teacher observations to go on.
  • A group-paced course is a better environment for the typical student: Before a student is allowed to attempt Algebra 1/2 or Geometry credit recovery from an independent-paced math class, they need to fail or nearly fail a course.  We do this because a computer-based math class costs more than using our own curriculum and we're afraid that it might be easier than our curriculum (kids trying to take the path of least resistance could avoid our material).  What if everyone had a flexible-paced environment using our curriculum and cost wasn't a factor -- would that be worse than having large groups of kids moving through together?
  • Subject-separated courses taught by content experts is the best way to organize middle and high school: This assumption drives me nuts.  I have little proof on this being wrong and it is such a deeply ingrained conventional wisdom that is reinforced by the state's teacher licensing system that it would be hard to change even if there were experiments done that proved it wrong.
There are plenty more assumptions that I think stand on shaky ground.  The Lean Startup has energized me to think more about these assumptions and think of creative ways to validate them as objectively true or false.  As a statistics teacher, I especially feel like it is my calling to help in the design of experiments that can assess more causation than we're used to in education.